
Many people have seen analytics maturity curves. Most look the same — which is too bad because they take us in the wrong direction. They tend to look something like this:
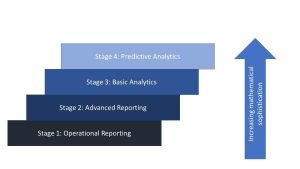
In essence, this model is saying that maturity is all about moving from simple math to complicated math. Is that really what we should mean by maturity?
We’ve long noticed that doing most successful analytics work — and by that we mean work that has an impact on the business — involves little more than counts, ratios, and percentages. Yet because such work is based on presenting simple data, these successful analytics projects would be mapped near the bottom of the maturity curve.
For example, a rapidly growing Bay Area tech company was struggling to fill certain technical roles. The line managers felt the solution was to increase compensation, while the talent acquisition team felt the solution was to hire in other job markets. The people analytics team got an estimate of the number of people with the necessary skills in the area and compared that to the number of people the talent acquisition team had already contacted. The data showed that the company had already contacted a high percentage of the available talent — they had “fished out the pool.” With this insight they realized they had to expand their horizons and hire from other geographic regions.
From the business’ point of view, this was a highly relevant insight. Yet from a mathematics point of view, it was just looking at the ratio between two numbers (number already contacted/total number of qualified people). Pretty simple.
Now, granted, there are important cases of companies using far more sophisticated math to provide relevant insight to strategic decisions. That’s great. But the overarching point is that business leaders do not care about the sophistication of the mathematics used to uncover a useful insight. They only care about the business value of the analysis.
Therefore, a better analytics maturity curve looks more like this:
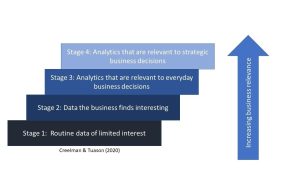
This new model of analytics maturity goes from low relevance to high relevance. It recognizes that we don’t have enough recruiters to hire enough sales reps to meet the revenue targets we promised inventors — which is Stage 4 here. The math is dead simple: We know how many sales reps we will need and we know how many recruiters it will take to hire them. But again, to leadership, this is Stage 4 in relevance.
On the other hand, if you use machine learning to predict employees’ preferences on benefits, then that would be Stage 1 or 2 in this new model. It’s not a strategic issue, and in any case it may not be actionable.
Ultimately, people analytics teams that seek to drive up the relevance maturity curve have a bright future. People analytics teams that obsess on advanced mathematics will be risking irrelevance.