
The Q2 2018 PayScale Index showed wages declined 0.9% in comparison to Q1 2018. The PayScale Real Wage Index, which measure wage growth in relation to inflation, dropped 1.8% over the last quarter – the biggest decline in seven years. Due to inflation rising faster than wage growth, workers in Q2 2018 earned 1.4% less in “real wages” than they did one year ago.
According to Katie Bardaro, Vice President of Data Analytics and Chief Economist at PayScale, “There are a few exceptions to the wage decline. We are seeing higher wage growth for certain jobs as the tightening of the labor market continues and demand for certain talent outpaces supply. Therefore, our current strong economy could disproportionately benefit employees that are in demand, while the average worker is left behind.”
Key findings Q2 Index:
- Wages were generally down across the board last quarter:
- Wages fell in 80% of industries with 12 of the 15 tracked industries experiencing a decline
- Metros: 22 of the 31 tracked metro areas showed wage decline
- Job categories: 13 of the tracked 19 job categories also saw a decline in since last quarter
- With 4.2% annual growth, tech savvy San Jose, CA tops the list of metro areas for highest wage growth, and by a large margin. Cleveland, OH is a distant second with annual wage growth at 2.6%.
- Wages in the tech industry held steady between in Q2, though they are still 2.1% higher than one year ago. With 14.5% growth since 2006, tech has seen the second largest wage gains since the great recession, trailing only the engineering and science industry.
- The largest decline in wage growth was in manufacturing and production jobs, which saw a 5% decrease since Q1. Construction jobs also took a big hit in Q2, as wages in that industry declined by 4.7% last quarter.
- The industry with the largest decline in wages was in the transportation & warehousing industry where wages fell 2.9% last quarter.
- Accounting & finance positions (2.5%) along with art & design (2.4%) jobs posted the largest annual growth figures.
- Austin (2.3%), Orlando (1.7%) and Milwaukee (1.6%) had the largest decline in wage growth last quarter.
Why the difference with other reports?
You might be thinking “Well that doesn’t jibe with our incredibly low unemployment rate and the growth rate of wages as reported elsewhere.” We are fortunate to live in a data-centric world where access to sources of wage trend data is plentiful and several sources can be used to track different characteristics of the data.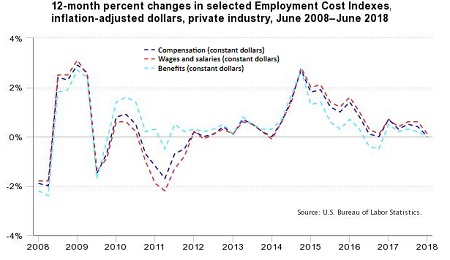
There are several macroeconomic indicators that are used to track wages including the PayScale Index and the Employment Cost Index (ECI). The key difference between the two are that the ECI tracks employment costs within organizations, while the PayScale Index tracks workers’ wages across organizations. This means the PayScale Index will capture how workers’ wages change as they switch companies, while the ECI does not.
The U.S. Labor Department’s Bureau of Labor Statistics reported that in June real average hourly earnings rose by 0.1% over May. But on a year-to-year basis, there was no increase.
The important thing to remember is each measure has its own underlying methodology that can make comparisons across them difficult or even inaccurate, so be sure to understand the underlying methodology of any metric before you make any conclusions.
Will the trend continue? One quarter tells a story, two or more quarters builds a narrative. Stay tuned.
Click here to see the entire interactive Q2 2018 PayScale index, which reflects wage trends across various industries, job categories, company sizes and major metros, including Canada.