
What are analytics and how are they different from reports?
Simply summed up: “Reports provide data; analytics provide insight,” which is true, but not really helpful if you don’t know how, or why, this happens to be the case.
I have discovered that there are layers to understanding – the more technical you get, the more you can understand the difference and potential of analytics. This article discusses the differentiators between reports and analytics, and the unique outputs of each.
Operational versus insightful
The first significant difference between reports and analytics is the source of the data.
Your basic reports are run against the system in which the data was originally created, such as your HRMS, Learning Management System (LMS), or Accounts Payable system. These systems are transactional – or operational – meaning they are designed to help you efficiently perform certain tasks and keep records of those tasks. While these systems provide reporting options, it’s not their primary purpose.
“Reports provide data; analytics provide insight”
Take for example the hiring of a new employee. HR needs to create a record for that employee that captures their basic information, job title, and manager. This “hire” transaction – the creation of a core employee record – is performed in the HRMS. Once created, this record can then be accessed in other areas of the HRMS to perform new actions, such as benefits registration, IT provisioning, and payroll processing.
However, there’s no single record that includes every event or action for an employee – the system simply couldn’t operate if it had to access a giant file like this each and every time a user accessed an area of the system. Instead, the records of each transaction are split across the HRMS and only the ones necessary are accessed – a pay record here, benefits over there, and performance reviews somewhere else – each with a connection back to the core employee record, but not to each other.
Why?
Technical limitations
Because the technical structure underpinning transactional systems are designed to facilitate system performance so you can complete all of your actions quickly: searching up a record, making a change, and saving that change. However, this same structure also makes it difficult (if not impossible) to create reports that are sourcing data from different locations within the system.
Data is stored separately to specifically optimize performance. Bringing the data of every event or action from different tables together in a report can slow down the system, sometimes to the point of stalling it entirely. (In the past, I’ve had to open many a support ticket to have a server restarted after an overly-ambitious report caused it to grind to a halt.)
Analytic solutions, meanwhile, are designed specifically to connect data from different records (more on this in the Siloed versus Unified section below), transform and normalize it, and facilitate the exploration of that data. The restrictions and connections necessary in a transactional solution aren’t needed in an analytic solution; the data can be structured and organized to optimize analytics.
Where your HRMS can’t store a single thread of every event involving an employee, a well-designed analytic solution can.
Data can be connected and joined in a fashion that optimizes retrieval, especially when coupled with a powerful query engine. For example, Visier’s query engine can execute complex queries literally millions of times faster than a traditional database.
Static columns versus dynamic definitions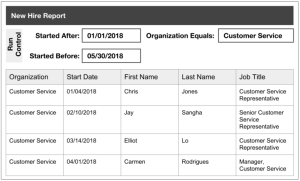
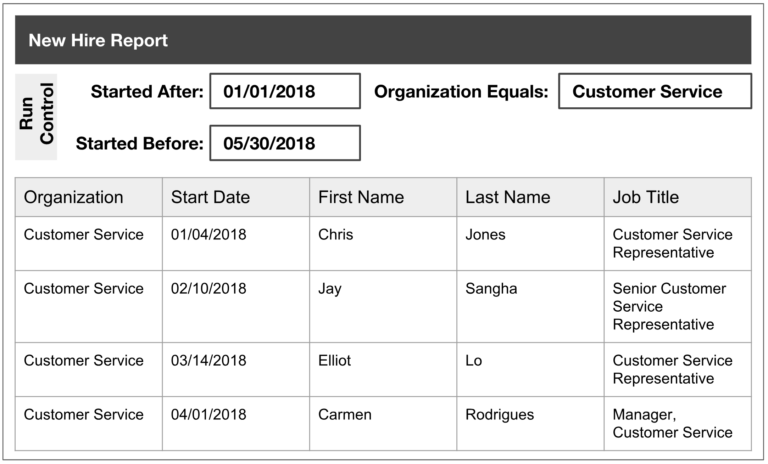
Reports in your transactional system are defined before you run them, and these definitions include which data columns will be included in the report. You may have controls on your report that allow you to set parameters for the report results, such as date range or by organization, but you’re still limited to receiving just those columns in the report.
If you want different columns, you’ll need to run a different report or, if you have access to the report writing tool, you’ll need to write your own report and then run it.
On the other hand, analytics display results for the selected parameters in a visualization intended to illustrate patterns and trends, bringing insights to the forefront without you or your team having to do any of the heavy lifting.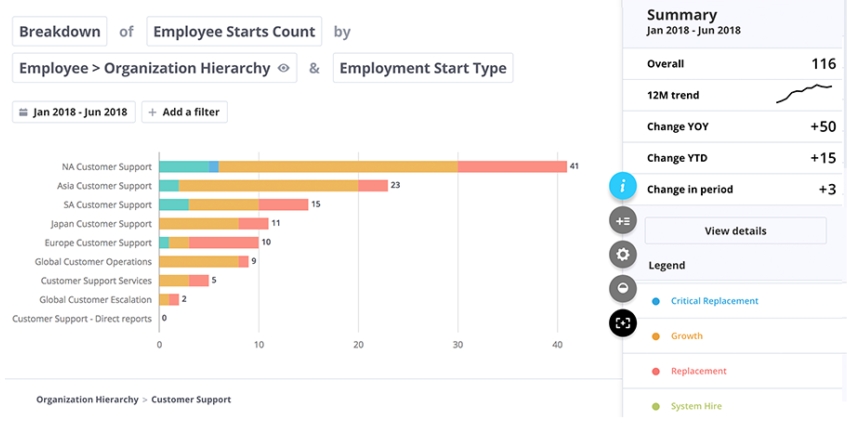
In addition, analytics encourage exploration, as well as the user’s natural inclination to see the results and ask themselves, “I wonder what else there is?” The viewer can change or add filters to get new results in real time. In the image I added an additional metric of “Employment Start Type” and the results refreshed immediately.
Again, because analytics is dynamic, the user has the ability to drill even further into the details.
Siloed versus unified
Very few businesses leverage a single system for absolutely every business transaction. More often than not, it’s an enterprise solution that’s used to perform the core functions (such as an HRMS for employee data, benefits, payroll), with niche, best-of-breed solutions, such as an LMS, employee engagement tool, or an Applicant Tracking System (ATS), used to manage other functions relating to the employee. This means that there are employee-related records in multiple solutions.
When data relating to a single object (such as an employee) resides in different solutions like this, the only way to look at that data side-by-side is to pull separate reports and then, manually manipulate the files to create a single report. This becomes even more complex when organizations have multiples of the same solution (multiple payrolls, multiple HRMSs, and more). It becomes nearly impossible to get something as simple as an accurate headcount number!
An analytic solution brings all the data together. When it’s properly designed, it creates the connections across all of your data points, giving you a seamless and single point of access across your entire organization.
For example, it can be impossible to get measures on your quality of hire because your ATS can’t see what happens to the candidates once they’re hired. This is due to their employee data residing only in the HRMS and other employee solutions.
But when you unify recruiting data with information from the rest of the employee lifecycle, you are able to follow the thread from the point of hire and beyond, and spot important trends that could impact retention, productivity, engagement, and more.
As-is data versus transformed data
When you run a report against your transaction system, the data that is returned is exactly as it exists in that system’s database. These reports present a snapshot in time, which is great for giving you a read on what has happened up until today, exactly as it was captured. For example, How many people started? How many performance reviews were completed? How many people got 5s?
Analytics takes all this transaction data and boosts the value of the information so you can look at what has happened up until today, but also what could happen in the future. This is done by:
- Transforming existing values
- Deriving new values
- Predicting future values
Let’s look at each of these in detail.
1. Transform
When transactional data is sent to an analytic solution, there is an opportunity to transform the data values that exist in the source system into new values, either to introduce standard values or to correct for common data-entry mistakes.
For example, an organization that has two solutions for performance – one using a 4-point rating scale and one with a 5-point scale – wouldn’t be able to look at performance across the organization in a meaningful way because top performers from the 4-point solution would just look like above average performers alongside the employees who got a 4 rating from the 5-point solution.
In order for the data to be combined or compared, transformation rules would be written and applied to the performance scores so that they are aligned on the same scale. So, to apply a 5 point scale across the board, the transformation rule turns a “4” from the 4-point solution into a “5” and a “3” would be transformed into a “3.75.”
2. Derive
Once the data has been added to the analytics solution, the query engine (the mechanism that retrieves the correct data for the user, based on what analysis the user has chosen to look at) can derive new values from the existing metrics.
For example, an organization may choose to define the “Top Talent” metric to mean those employees with top performance scores, critical jobs, and a tenure longer than 5 years. The solution stores the data for performance scores, and critical jobs. When the user chooses to look at an analysis that includes “Top Talent,” the query engine first calculates tenure (based on the stored Start Date), then determines which employees meet the “Top Talent” qualifiers. This new metric is calculated in real-time each time the query is run, offering a more nuanced, value-added view of the performance data.
3. Predict
Powerful analytic query engines can also predict future actions based on the patterns of the past; the difference between reviewing who has left and predicting who will leave. For example, Visier uses the random forest predictive methodology which you can read more about here.
Insights – not data – lead to results
So, at last, we come back to the adage we began with: “Reports provide data; analytics provide insight.” What this article has attempted to show is that reports are the outputs of systems that are designed to perform actions – not provide insight.
Insight is the deeper understanding you get of the actions and behavior behind all of the data points you’ve gathered. It is the ability to make out the big picture from the millions of brush strokes that created the painting.
Taken individually, an employee record tells you about one employee. A report on hundreds of employees tells you about hundreds of employees – but an analysis of all this employee data can illustrate the connection between new hire training and turnover.
The insight comes when you can see that employees who have participated in the new onboarding training have a lower rate of turnover; therefore, it may be worth expanding the pilot across the organization. With this insight, you can make the business case for the program to your leadership.
An analytic solution leverages all of the data created by your transaction systems so you can explore it from many different dimensions and get real insight into your organization. Because analytics connect data in a way that facilitates explorations, displays patterns and trends through visuals that enable understanding, normalize data to facilitate comparisons, and derive new values that boost insight, analytics are a much more powerful business transformation tool than reports could ever be.