
It took an average of 27.6 working days to fill a job in May, according to the latest data from career site publisher DHI Group. That’s the fewest days since January, and almost 3 days less than it took in April.
If that sounds like good news to recruiters and employers, it is and it isn’t. The May decline of 2.8 working days is the largest in the 16 years of monthly data reported in the DHI Hiring Indicators.
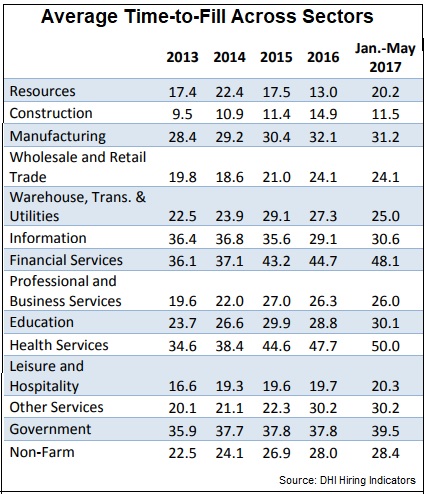
But note that some sectors are taking even longer to fill a job. Since the beginning of the year, jobs in health services take an average of 49.3 days to fill. Financial services too is up, now taking 45.6 days on average.
 In the decade since 2007, May’s time to fill has come in lower than in April half the time. In most years, the time to fill has climbed back up in the next month or two. Whether that will be the case this year won’t be known until later this month, when DHI releases the June report.
Only taking a breather
O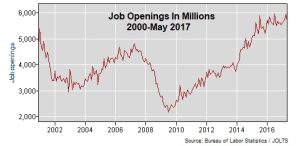 ther indications are that the time to fill may only be taking a breather. The Bureau of Labor Statistics says there were 5.67 million job openings in May. A year ago, there were 5.58 million.
The 90,000 difference may not seem significant until you also factor in other employment numbers like job creation, turnover and the labor force participation rate. Just looking at those three factors we find:
- The annual turnover rate is climbing. Taking into account all separations — retirements, layoffs, firings, etc. — the national average in 2016 was 41.9%, up from 37.4% in 2012. Voluntary quits, where the employee gives notice, usually to take another job, came in at 25% last year. In 2012 it was 18.7%.
- The labor force participation rate in June was 62.8%, practically unchanged since the year before. It’s close to the lowest rate in 50 years, though up a bit since hitting bottom in September 2015.
- From June 2016 to June 2017, the BLS said employers created 2.24 million new, non-farm jobs. During that same period, the number of employed workers rose by only 2.08 million. Meanwhile, the ranks of the unemployed thinned by 800,000 to 7 million.
Fed says it’s hard to hire
These are all part of the reason for the recruiting difficulty that is widespread nationally. The Federal Reserve took particular note of the hiring situation in its July “Beige Book,” saying:
Labor markets tightened further for both low- and high-skilled positions, particularly in the construction and IT sectors. Contacts across a broad range of industries reported a shortage of qualified workers which had limited hiring.
A jobs calculator developed by the Federal Reserve Bank of Atlanta tells us the nation needs to create just over 115,000 new jobs a month to absorb the number of people entering the workforce. Employers, though, have been adding an average of 187,000 new jobs a month since June 2016.
A TLNT article last week — “The War for Talent Is About to Go Nuclear. Here’s Why and What You Can Do” — describes some additional factors that are contributing now and for the foreseeable future to a labor shortage.
Increasingly, then, that sharp turnaround in the DHI Vacancy Duration measure looks more like a blip than a trend. In fact, a Bloomberg survey of economists predicts that when the Labor Department releases the July employment report on Friday it will show unemployment dipping to 4.3% (from June’s 4.4%) and that employers added about 178,000 new jobs last month.
No wonder then that SHRM’s LINE report shows the recruiting difficulty index climbing every year since 2014.